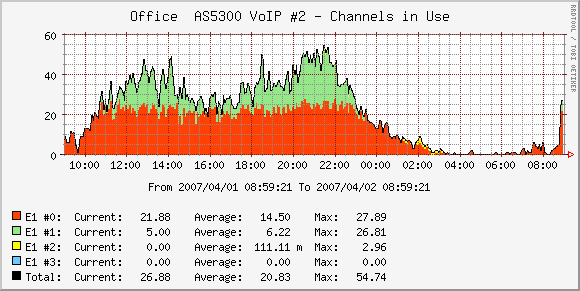
This post is as much a reference for myself as it is for others. I had a need today to start graphing E1/PRI channel usage on some Cisco AS5300’s. The current priority is a simple graphical representation of the actual usage:

Hopefully at some point over the next couple of weeks I may expand this to other more interesting information such as average call duration, etc that can be useful to diagnosing issues almost as they happen.
The Cacti XML can be found here and I just posted the same to Cacti’s own forums here.
The CISCO-POP-MGMT-MIB provides the MIBs for this information and the ones I specifically used (for my AS5300 which are all identical with 4 E1/PRI ports) are cpmDS1ActiveDS0s.0.x (or .1.3.6.1.4.1.9.10.19.1.1.9.1.3.0.x). Replace x with the appropriate port number (0-3) as required.
Explore the available information yourself with:
$ snmpwalk -Os -c <community> <host> .1.3.6.1.4.1.9.10.19
Hi Barry I have been working on Cacti xml scripts to get the same information that I think you are getting with your I was able to import the graph templates but what are you using for the dast source?
Greg
Hi Barry.
Thanks for the useful template.
The only thing I changed is “GPRINT Type”. I changed it from “Normal” to “Exact numbers”. By doing so, I eliminated a wierd output like 21.88 channels and have integer numbers instead.
Hope this helps to you and others.
Denis Astafyev.
Hi barry
Do you have a solution by register Cdr’s files from my equipment Cisco as5400 and quintum, please if you have contact me please i need urgent.
Thanks and regards
Erick
Hi Barry,
I’m also trying to graphing AS5350 E1s in Cacti. Those E1s are as 3/0 , 3/1, 3/2 and 3/4. How do I graph them.
Kula.